

One nice byproduct of having SMBs discover and price their purchases through Kinnek is that we get to understand the types of demand in the market. We can drill down into the demand because we develop a taxonomy for the products buyers can get quotes for on our platform. This taxonomy, born from research as well as buyer and supplier input, is the information we’ve found necessary for suppliers to properly understand and quote a buyer’s request.
One thing we can look at for each product is the diversity of its demand. That is, what types of feature combinations exist for a product and how popular are they? For example, one taxonomy of a wine bottle we have suppliers for is a corked, punted bottom, 750 ml, non-frosted, Bordeaux bottle, and we can compare its popularity to a screw cap, flat bottom, 750 ml, non-frosted, Bordeaux bottle, or any other combination in our taxonomy.
We can also think of this as a measure of feature popularity and trends (if we look at how the distribution changes through time). But for now we’ll consider the static ecological diversity angle. Let’s first take a quick look at how we can measure diversity. A general definition can be written as:
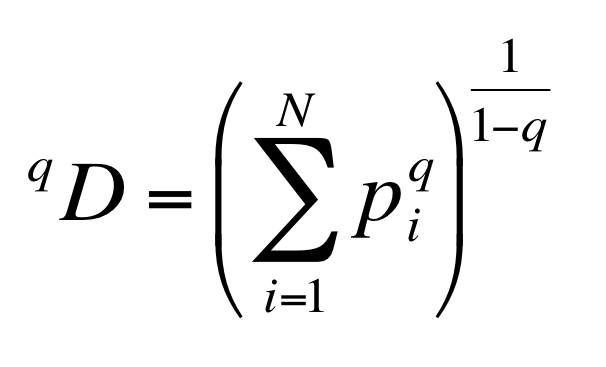
where N is the number of items in your ecosystem and p is their demand as a percentage of total demand. The parameter q controls how much weight is attributed to the abundant items in your ecosystem. A higher q means a higher weight to the most popular items. You might be thinking ‘isn’t this basically the power mean?’ Yeah, it is. But things are always being slightly changed and reapplied to great effect:

The most common form of this generalized diversity is q=2. This corresponds to the (inverse) Simpson index (the most widely used form in ecology), and the Herfindahl-Hirschman index in economics (the Lethal Weapons 3 and 4 respectively).
We’ll consider the diversity index of order q=2 as well and see what this looks like for a couple of products in the beverage vertical (wine bottles, liquor bottles, growlers, and bottle filling machines):
- Wine bottles: 26.2
- Bottle filling machines: 445.0
- Liquor bottles: 6.0
- Growlers: 25.8
These are unitless quantities, so the interpretation isn’t exactly clear. Bottle filling machines have a diversity index ~75x higher than liquor bottles and ~17x higher than wine bottles and Growlers. So the ecosystem of bottle filling machines is much more varied and nuanced relative to liquor bottles, growlers, and kegs. This isn’t too surprising, given that a bottle filling machine is a big intricate piece of machinery, but the fact that wine bottles is ~4x liquor bottles isn’t as obvious. This is a consequence of the fact that one of the most popular product combinations of liquor bottles (glass, 750ml, bar top/cork bottles) bottles represents nearly 40% of requests, whereas one of the most popular types of growlers (amber, 64 oz, screw cap, growlers with 1-color imprint artwork) represents around 15% of all requests.
So, who cares? Well, we do. And the supply side should as well. It not only helps us understand how to optimize the information we collect for suppliers to accurately quote buyers, but it could allow suppliers and even manufacturers to better understand demand across a wide range of buyers and product types, rather than by a particular brand or item. Even buyers who want to buy the hippest bottle on the market might care.
As we better determine our thresholds for what constitutes diverse vs. concentrated and optimize our taxonomy, we’ll be defining our own tailored version of diversity.
Subscribe to our blog to get the latest Kinnek news.